BTS Worker 提案 - 数据可视化:调研,设计和实现
BTS Worker Proposal - Data Visualization:Investigation, Design and Implement 背景 Bitshares自问世以来已经稳定运行超过3年的时间,目前链上已累积了110W+账户,3k+用户发行资产(UIA),以及2亿+条账户历史数据。作为去中心化交易所,BTS确实借助于其高性能、高隐私性以及高灵活性取得了很大的成功,但是,目前也有一些不足之处需要改进。
我们对目前市面的BTS区块链浏览器以及数据分析产品进行调研后,发现社区中缺乏一个有深度的资产数据、账户活动记录可视化分析工具,我们无法直观的甄别优质资产,也无法洞悉某个账户的历史行为,等等,这些宝贵的数据就像是一座金矿等待发掘。此外,一个基于全量历史操作记录的自定义导出工具对用户来说也是十分重要的,用户一方面可以将其历史操作数据备份到本地,另一方面可以按照自身需求进行额外的分析处理。
对于开发者来说,一套完善的链上数据查询及统计结果API对其快速接入BTS链具有至关重要的作用,但是,目前社区中的API实现方案各异,没有一个统一的标准,而且,现有API方案并没有将内外盘的交易数据放在一起进行总体分析。
我们提出本worker以期能够能够解决以上问题,为社区的进一步完善做出贡献。
Background Bitshares has been running stably for more than three years, and has accumulated 110W+ accounts, 3k+ user issued assets (UIA), and 200 million+ historical account data. As a decentralized exchange, BTS has achieved great progress for its high performance, privacy and flexibility. However, there are still some drawbacks to overcome.
After investigated the current BTS blockchain browsers and data analysis products, we found that it lacks of a tool to in-depth analyze and visualize asset data and account activity in BTS community. We cannot intuitively identify high-quality assets or understand certain behavior of an account, and so on. The on-chain historical data is like a gold mine waiting to be discovered. In addition, a customized export tool of full historical operation records is also very important for users. Users can back up their historical operation data locally. On the other hand, they can perform additional analysis and processing according to their own requirements.
For traditional developers, a complete set of on-chain data query and statistical results API is crucial for BTS blockchain based development. However, the API implementation schemes in the community are different such that there is no uniform standard. Moreover, the existing API solution does not collect the transaction data of CEX and DEX for overall analysis.
To solve the above questions, we propose this worker to do our contributions for BTS community.
目标 针对以上问题,我们提出并将实现一套数据可视化、API及数据导出方案,其主要涵盖以下几点:
1)明确的可视化需求。根据我们的理解,已经列出了十余项的可视化需求。用户需求是本worker 的出发点与目标。
2)丰富实用的 API 接口,涵盖传统与所有可视化需求的接口,同时满足更深层次、定制化的数据查询需求。
3)数据可视化Demo。基于上述API实现数据可视化的部分Demo案例,供社区使用。
4)开放的源码。该worker中涉及到的API及Demo源代码,均采用MIT协议对外开放,方便社区对其进行继续改进。
Goal To solve the above problems, we propose and will implement a solution about data visualization, API and data export solutions, including:
1) Clear visual requirements. According to our understanding, more than ten visualization requirements have been listed to meet user requirements.
2) A rich and practical API that covers the traditional and all visualization requirements as well as meet deeper, customized data query needs.
3) Data visualization Demo. Part of the Demo will be implemented for data visualization based on the above API.
4) Open source code. The API and Demo source code involved in the worker will open to the outside world using the MIT protocol, which is convenient for the community to improve it further.
我们的方案 为实现上述目标,我们的方案是:
1.调研可视化需求。
从微信、论坛、Telegram 等多个渠道发起问卷。广泛收集并分析BTS用户对数据可视化的需求,并分析其合理性(目前已经整理的需求见“用户需求分析”)。
2.数据的存储与采集方案
a)选择合适的数据存储方案。 针对具体的可视化需求选用合适的数据方案,包括但不限于 ES Plugin , PostgreSQL做部分数据支撑。
b)设计外部数据采集方案。对不同交易所集成对应的数据采集方式。再结合数据用途与各交易所差异性,在储存前尽量完善数据。
3.设计并实现API接口。
a) 传统的Bitshares API 接口,包含目前的基础功能
b) 可视化的数据 API,包含所有本次要做的可视化功能
4.实现可视化 DEMO
实现可视化需求的 DEMO,主要使用 echart.js,个别可能会采用d3.js,为其他开发人员提供参考
Our plan In order to achieve the above objectives, our plan is:
1. Investigate visualization requirements.
Questionnaires will be launched on multiple sources such as WeChat, Forum, and Telegram. The requirements of BTS users for data visualization will be widely collected and analyzed for their rationality (see “User Demand Analysis” for current collections).
2. Data storage and collection scheme
a) Choose a proper data storage solution. Choose the good data solution for the specific visualization requirements, including but not limited to ES Plugin, PostgreSQL for partial data support.
b) Design an external data collection scheme. The corresponding data collection method will be deployed according to different CEX. We will normalize the data before storage from different sources.
3. Design and implement the API.
a) Traditional Bitshares API interface, including current basis function
b) Data visualization API, including all the visualization features to be done in this proposal
4. Visualize DEMO
Implement the visualization requirement DEMO, mainly using echart.js, maybe use d3.js, the code will provide as a reference for other developers
1、用户需求分析
1. User requirements analysis 1.1、合并内外盘BTS交易数据(仅支持提供API的交易所) 区块链是一个去中心化的全球设施,但是目前大部分虚拟货币交易都在交易所中产生,这就导致交易数据极为分散,难以判断虚拟货币的真实交易数。通过导入外部交易所BTS交易对数据,可以综合分析内外盘的数据,并提供更有价值与可靠性的分析结果,我们将开发如下功能:
1.1. Support BTS data from centralized exchange (exchanges that provide data api) The blockchain is a decentralized global facility, but currently, most of the virtual currency transactions are generated on centralized exchanges, which results in highly diversified transaction data. It is very difficult to evaluate the actual volume of transactions per day. By importing the CEX BTS transaction data, We can comprehensively analyze the data from CEX and DEX and provide more valuable and reliable analyze results. We will develop the following functions:
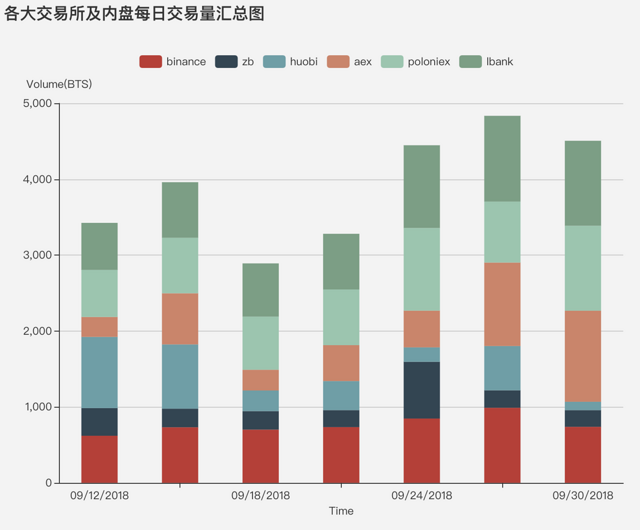
a、各大交易所及内盘每日交易量汇总
a. Summary of daily trading volume on major CEXs and DEX
上图中以一些交易所为例,我们期望用堆叠柱状图显示不同平台的BTS的日交易量,这样普通用户可以分析出各个平台的日交易量和BTS总交易量之间的关系。
In the above figure, we hope to show the daily trading volume of BTSs on different exchanges by the stacked histogram. Ordinary users can analyze the daily trading volume at each CEXs and DEX. The whole trading volume is shown as well.
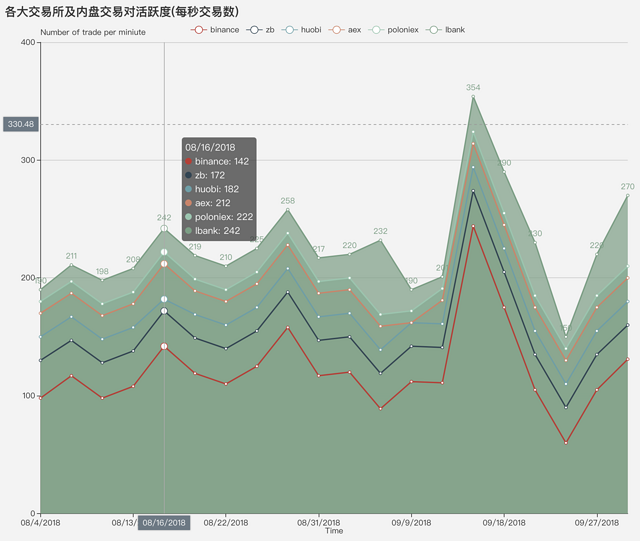
b、各大交易所及内盘交易对活跃度 (每秒交易数)
b. Trading activeness on major CEXs and DEX (number of transactions per second)
同样,上图中不同平台中每秒交易数可以反映出每天的交易活跃度,有利于普通用户选择交易所进行交易,同时也有利于分析出不同平台用户的交易喜好。
The above figure can show the relationship between number of transactions and time. It implies the daily trading activeness in each exchange, which is beneficial for ordinary users. Users can select exchange based on this chart. This figure is very helpful to analyze trading habits of different exchange users.
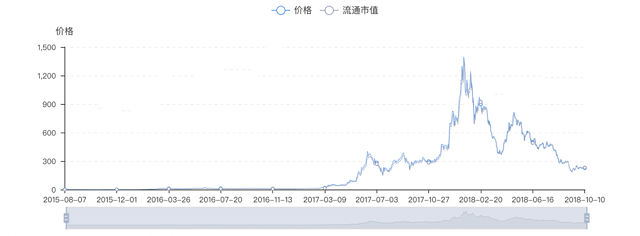
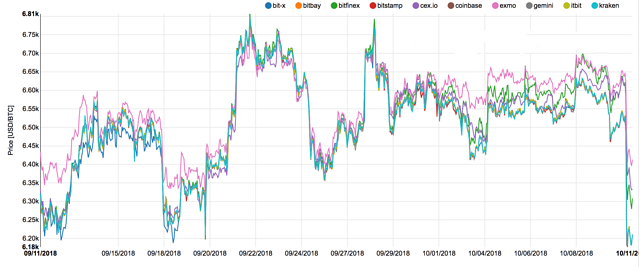
c、各大交易所及内盘历史价格展示
c. Historical price on major CEXs and DEX
如上图所示,不同交易所BTS的价格对比可以显示出平台的价差和用户喜好,同样有利于普通用户选择交易平台。
As shown in the above figure, the BTS price comparison of different exchanges can indicate user habits and lowest price, which is beneficial for ordinary users.
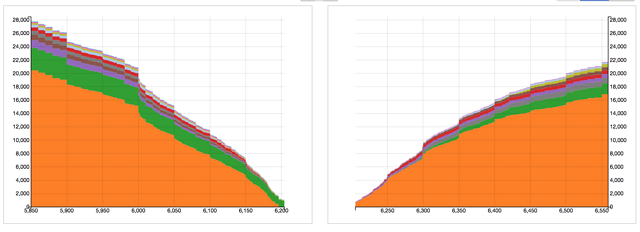
d、各大交易所及内盘买卖单深度汇总图
d. Collection of trading depth on major CEXs and DEX
我们计划合并不同平台中的买卖深度,这样可以很容易的看出当前市场BTS的交易总深度,有利于大额交易和普通用户的交易判断、平台分析。
We will combine the market depth on major CEXs and DEX, so that it is easy to show the total depth of the current BTS market. Large value order may be benefited from this figure. Trading analysis can be done according to this figure as well.
1.2、资产数据可视化分析
1.2. Asset visualization analysis智能资产和用户发行资产(UIA)是BTS的优势功能,但是目前存在垃圾资产过多,没有合适数据展示方式等问题,普通用户很难靠自己选择优质资产。我们计划对资产历史数据进行可视化分析,包括以下几个方面:
Smart assets and customized assets are the advantages of BTS, but there are too many useless assets and trade markets. However, data visualization methods are very few. It is difficult for ordinary users to find qualified assets by themselves. The updated asset related webpage will add the following features:
a、智能资产供应量vs 时间图
a. Chart of smart asset supply vs time
智能资产供应量随时间的变化程度会反应用户抵押情绪,而其它智能资产的供应量(比如bitCNY和bitUSD) 会对BTS社区的投票和策略产生极大影响,它与历史数据的对比对于交易本身也非常有意义。
The above chart will show the user's debt sentiment. Furthermore, the supply of other smart assets (such as bitCNY and bitUSD) will impact the voting and strategy from BTS community. The comparison with historical data is very useful on sell/buy decision.
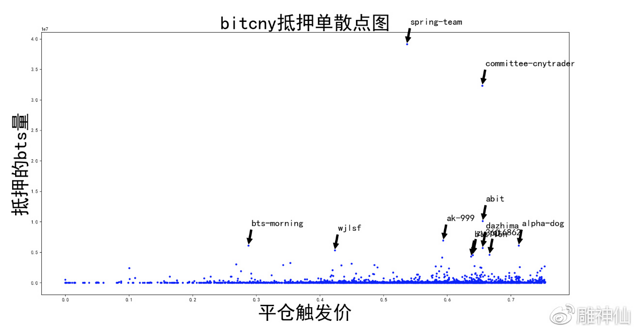
b、支持BitCNY,BitUSD的爆仓价格vs抵押资产数目散点图
b. Scatter chart on BitCNY, BitUSD's call price vs. number of debt asset
爆仓价格vs抵押数目散点图可以很显著的看出普通用户的抵押情绪,也就是当前的社区情绪,并且可以充分体现大玩家的带头作用,这项指标同样对社区投票和情绪有极大影响。
Scatter chart of BitCNY, BitUSD's call price vs. number of debted BTS can show the community’s debt sentiment. It also relates to the voting and strategy from BTS community.
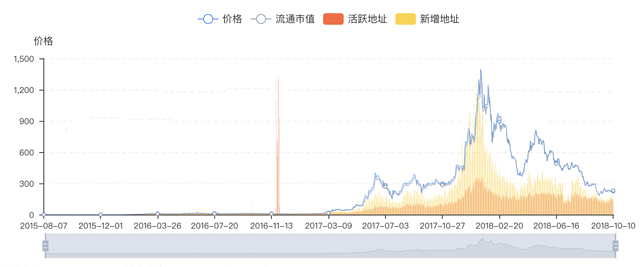
c、支持活跃地址数(当天参与交易地址数) vs 时间图
休眠地址数(30天未交易) vs 时间图
新增持仓地址数 vs 时间图
c. Chart of active address number (the number of participating trading addresses per day) vs time
number of dormant addresses (30 days not traded) vs time
number of new users vs time
参与交易地址数的活跃与否反映了内盘用户对交易的热情程度,一定程度上也反映了市场对当前价格的活跃程度和社区人数,休眠地址数,新增持仓地址数同样也是非常重要的指标。
The number of active addresses reflects the trading enthusiasm of the DEX user. It also reflects whether current prices are acceptable. The number of position addresses and the number of new address are important indicators as well .
d、持仓地址排序
d. Ranking of position address
持仓地址是衡量资产分布非常重要的一个指标,中心化程度过高的资产有潜在的操盘风险。这里我们提供各种资产的持仓地址分析和账户对此资产的操作情况分析。
Positions are a very important indicator of asset distribution, and centralized assets are risky to trade. We will implement the rank of position address and account operation analysis as well.
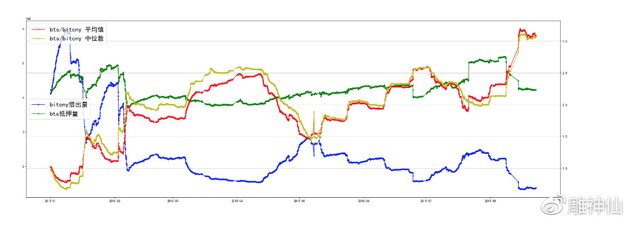
e、支持展示智能资产抵押量,借出量等
e. Indicators on smart asserts
对智能资产抵押量,借出量等数据分析同样有利于多维度分析智能资产的抵押用户和目标用户,以及智能资产健康情况。
We well show the number of bitCNY, the debt number of bts, average number of bts vs bitCNY and median of bts vs bitCNY.
1.3、 账户分析
1.3. Account analysisa、根据账户间的历史交易信息分析账户的关联账户
a. Related account analyze according to historical trading data
根据历史交易信息, 找出与该账户互动最为活跃的账户列表, 包括但不限于转账操作, 注册操作等
Based on historical transaction information, find a list of accounts that are most active in interacting with an account, including but not limited to transfer operations, registration operations, etc.
b、分交易类型的账户历史交易量统计, 包括不同交易类型交易量以及占比
b. Account historical transaction volume statistics, including transaction volume and volume/ratio of different transaction types
对账户交易类型进行统计分析, 可以有效分析账户的操作偏好, 根据挂单量/成交量可以推断该账户是否为自动交易机器人等
Statistical analysis of the account transaction type, it can effectively show the operating habits of the account. According to the amount of pending orders/volume, it can be inferred whether the account is an automatic trading robot.
c、账户某资产持有量随时间的变化曲线
c. Draw a curve about account’s asset amount vs time
分析账户资产的持仓情况, 可以看出该账户对此资产的偏好程度
Analysis the position of account assets, one can see the user's preference of this assert.
1.4、交易数据可视化分析
1.4. Data visualization analyze我们计划首先引入外部交易所数据,然后从以下几个方面对其进行分析
We are going to import CEX data, and then analysis according to these aspects.
a、交易对日交易量
a. Trading volume per day of the current market
b、与昨日相比的变化(交易量,最大交易,交易地址数)
b. Comparison with last day (Volume, Maximum transaction value, Number of active address)
c、大宗交易账户分析
c. Analysis of block trading accounts
分析一段时间内交易成交笔数,成交量较大账户列表.
Analyze the number of transactions in a period of time, an account list will be shown according to the trading volume.
1.5、见证人的喂价行为分析
1.5. Analysis of Witness's Feeding Behavior见证人的喂价目前几乎没有可视化的监控,而喂价又是BTS经济生态中极为重要的一环,对智能资产有至关重要的作用,我们计划可视化各个见证人的喂价,和距离平均喂价的程度,以作为参考。
There is almost no visual monitoring on the witness's feeding price. However, the feeding price is an extremely important part of the BTS economic system. It plays a critical role on smart asserts. We plan to visualize the feeding price of each witness and the average feeding price as a reference.
a、见证人喂价平均更新速度
a. Witness average update rate
见证人喂价更新速度是一些贴线玩家的必要参考数据,我们计划将这项数据作为表中的一个字段展示在页面上。
Update speed of witness feed price is a necessary reference for users, we plan to display this data as a field on the page.
b、见证人喂价偏离真实喂价曲线
b. A chart about how far witness feed price deviates from the system feed price
1.6、各节点的历史可用分析,及当前可用情况1.6. Availability analysis of each access node从其可用性分析可以看出该节点的连接可靠性以及稳定程度
The reliability and stability of the access point can be seen from its availability analysis.
1.7、 数据导出
1.7. Data export用户的链上操作记录有很多种不同类型,例如挂单,交易撮合,转账,投票等。一些用户希望能够提供根据时间区间,交易对,交易类型等关键字查询历史交易记录,并提供交易数据导出的功能来方便备份或者通过其他软件如Excel来进行分析。
基于需求,我们或用户就可以基于 BTS 的成交数据做更深层次的交易分析。 包括,某时间段内的交易概况; 某账号某资产的交易均价; 某账号的盈亏分析等等。
There are many different types of user operation records on chain, such as pending orders, transaction matching, transfer, voting, and so on. Some users want to get historical transaction records based on time intervals, transaction pairs, transaction types and other keywords, and provide transaction data export functions to facilitate backup or analysis through other software such as Excel.
Based on the data export, user can perform better transaction analysis based on the BTS transaction data. Including, the overview of the transaction within a certain period of time; the average transaction price of an account on one assert; the profit and loss analysis of an account.
2、其他 结合社区意见,适当添加其他功能。
2. Others We will add some other functions according to comments from the community.
以上所有的数据的底层数据,都会由“我们的方案”章节中的开源项目支持。同时,以上具体功能可能会随着社区意见和开发进展调整。
All above underlying data will be supported by our open-source project. The above functions may be modified as community comments and development progress.
负责团队: Bts.ai 团队我们已经是一个较为成熟的团队,主要开发人员有着丰富网站开发经验,同时将在未来雇佣更多开发人员以加快开发速度。
联系我们:https://t.me/btsai
Our team: Bts.ai teamWe have been a mature team; the major developers own a lot of experience on website development. We will hire more developers in the future to speed up the development.
Connect us:
https://t.me/btsai主要成员包括:主要开发者: vianull, Chen188
设计: Zheng
数据分析师: tiancaomei
产品负责人: vianull
运维负责人: wukoo
测试负责人:jie
Our team members include:Core Developer: vianull, Chen188
Designer: Zheng
Data Analyst: tiancaomei
Product Manager: vianull
Operation and Maintenance Manager: wukoo
Tester: jie
时间: 更新计划将从2018年12月5日开启,持续4个月,于2019年4月5日前结束。开发人员将在12月5日起尽快开始工作,以上列举的每一个功能都将经过测试后上线,每个1个月将会发布一次进展报告,每周通过网页公布开发进展。
预计开发工作将会按阶段完成,但是因为网站开发存在一定的不确定性,有可能会导致进度延迟。如果出现这种情况,我们会在开发进展中公示进度延迟的原因和重新估计后的时间。
Time: The updated plan will start on December 5, 2018. It will last for about 4 months and end on April 5, 2019. Developers will start work as soon as possible from December 5st. Each of the functions listed above will be tested before online. Production report will be published every month. The development progress will be announced on the website every week. If the function is stable, we will update the bts.ai webpage online immediately.
It is expected that the development will be on schedule, but there may be a delay during development due to force majeure and inscrutability. If it happens, we will announce the reason on the website and then re-estimate developing period.
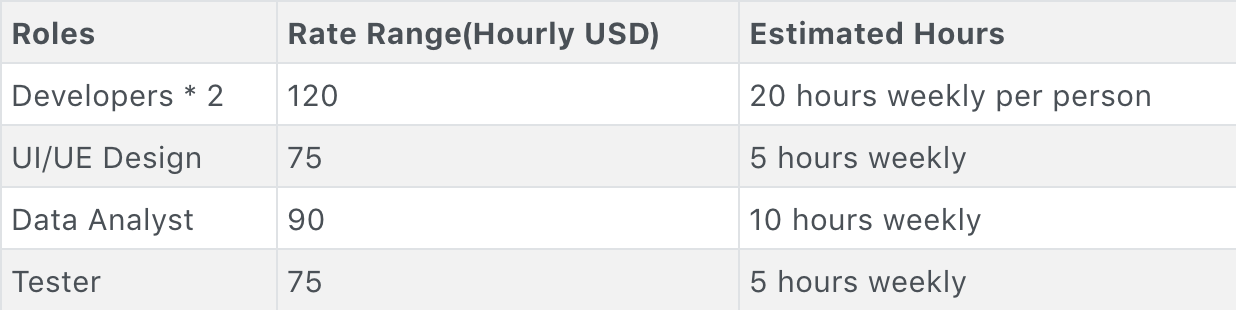
资金 整个项目的工作有的工作量较大,需要梳理的数据很多,不过我们对此有充足的准备。在资金预算上我们规划如下表:
收到的资金将被托管在datasolution-worker-escrow账号里,该账号由 @bitcrab @jademont @abit 2/3多签,托管人每4周将收到的资金转换成等价值的bitCNY 并将所有多余的 BTS 返回资金池, 就像http://www.bitshares.foundation/worker/中描述的那样。为防止 BTS 下跌至0.3bitCNY/BTS造成的风险,我们每天的预算为20000 BTS,多余的会返回资金池。
同时由于软件开发资金只能事前预估,本团队也将承担一部分风险。多重签名的托管人员负责评估发布软件的质量。所有的支付将公开透明。
Fund The workload of this project is very large. There is a lot of data to be sorted out, but we are well prepared for it. We ask to be funded according to the following table.
Our received fund will be hosted in the datasolution-worker-escrow account, which will be 2/3 signed by @bitcrab @jademont @abit. The escrow account will exchange the received BTS into bitCNY and return all excess BTS to the pool, as explained in
http://www.bitshares.foundation/worker/ (Under Escrow Worker Model). In case BTS price below 0.3 bitCNY/BTS, we ask for 20000 BTS per day. All excess BTS will return to the pool.
Because the software development can only be estimated beforehand, our team will also face some risks as well. The multi-signed escrow takes response for evaluating the quality of the released software. All payments will be open and transparent.